January 17, 2023
Maven Space Challenge
Full challenge details - Introducing the Maven Space Challenge.
Link to GitHub repository, including data and final output.
About the dataset
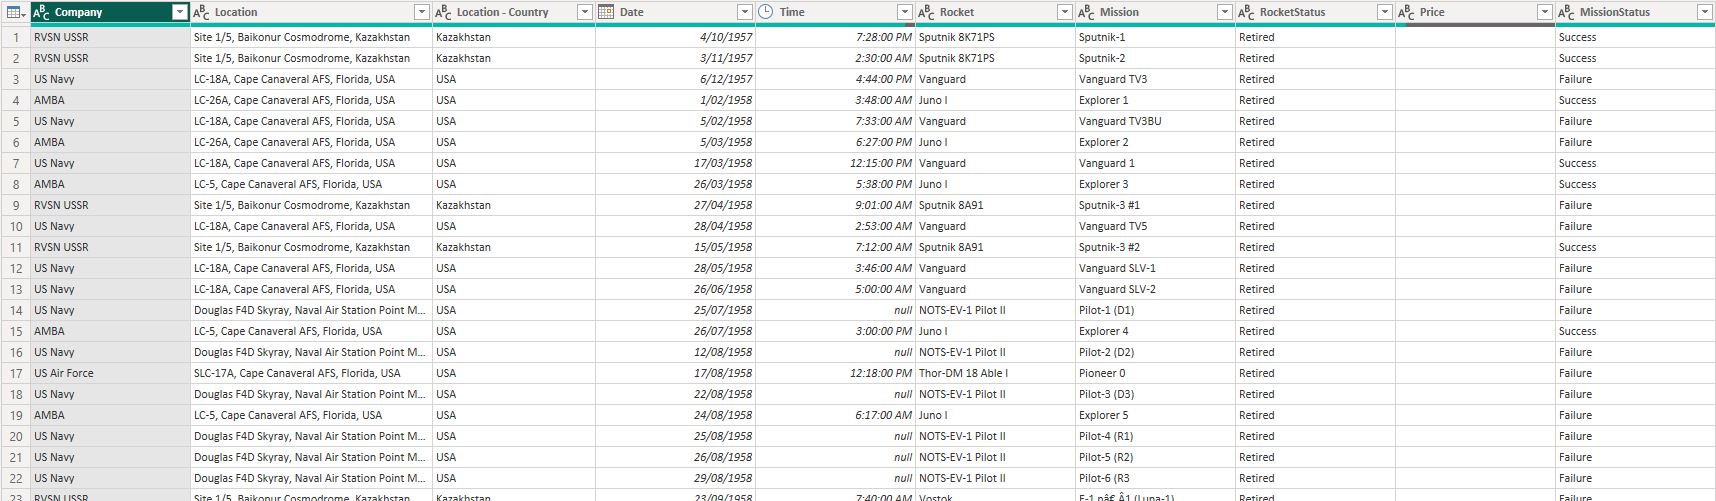
4,631 records of all space missions from 1957 to August 2022, including details on the location, date, and result of the launch, the company responsible, and the name, price, and status of the rocket used for the mission.
How to play the Maven Space Challenge
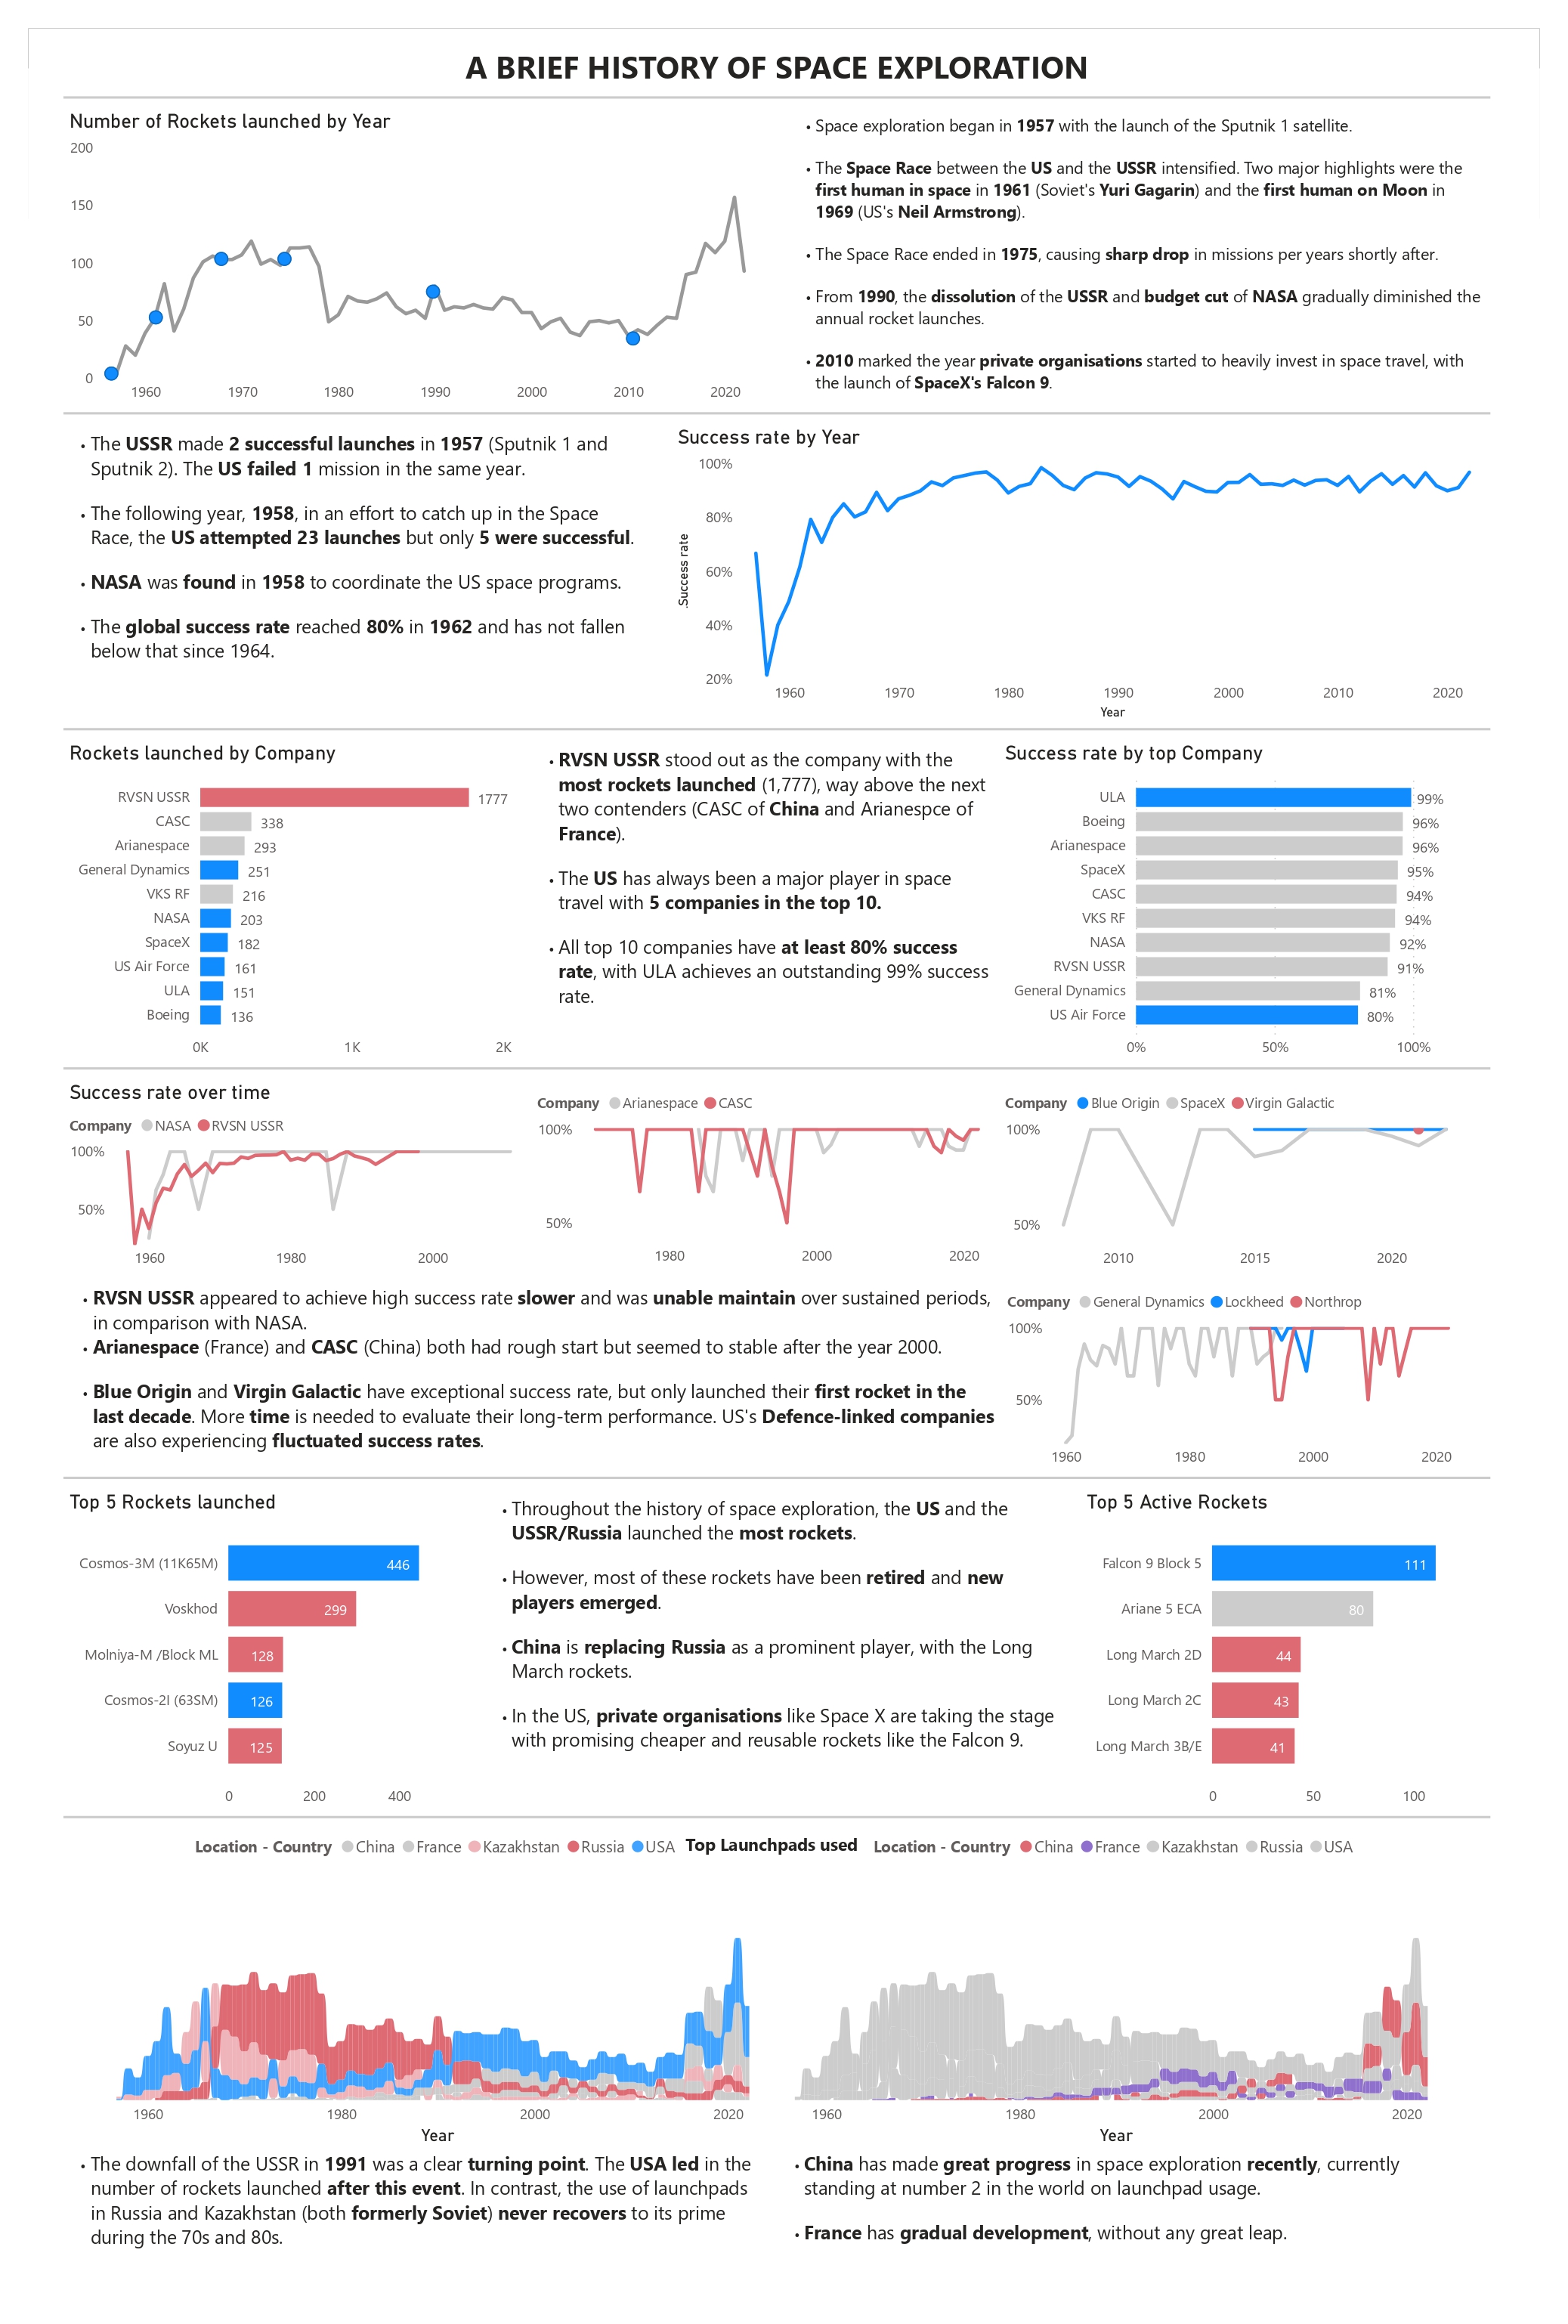
In this challenge, I presented a single-page data visualisation that captured our history with space travel.
Guiding questions
- How have rocket launches trended across time?
- Has the mission success rate increased?
- Which countries have had the most successful space missions?
- Has it always been that way?
- Which rocket has been used for the most space missions? Is it still active?
- Are there any patterns you can notice with the launch locations?
Import and transform data
Import the table into PowerBI, choose Transfrom data.
Create a new column to capture the country of the launchpads via Column from example.
Visual design
1. How have rocket launches trended across time?
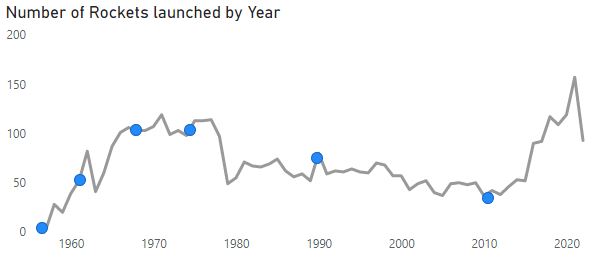
This question asks about a trend over time. Hence, it is best to use a line chart. I used the number of rockets launched as the Y-axis. I added some data labels to key events during the period shown. This required some readings on space exploration, the Space Race and the commercialisation of space travel.
Insights:
Space exploration began in 1957 with the launch of the Sputnik 1 satellite.
The Space Race between the US and the USSR intensified. Two major highlights were the first human in space in 1961 (Soviet's Yuri Gagarin) and the first human on Moon in 1969 (US's Neil Armstrong).
The Space Race ended in 1975, causing sharp drop in missions per years shortly after.
From 1990, the dissolution of the USSR and budget cut of NASA gradually diminished the annual rocket launches.
2010 marked the year private organisations started to heavily invest in space travel, with the launch of SpaceX's Falcon 9.
2. Has the mission success rate increased?
We cannot directly get the success rate from the dataset. A measure is needed:Success rate =
DIVIDE(
CALCULATE(
COUNT(space_missions[MissionStatus]),
space_missions[MissionStatus] = "Success"
),
COUNT(space_missions[MissionStatus])
)
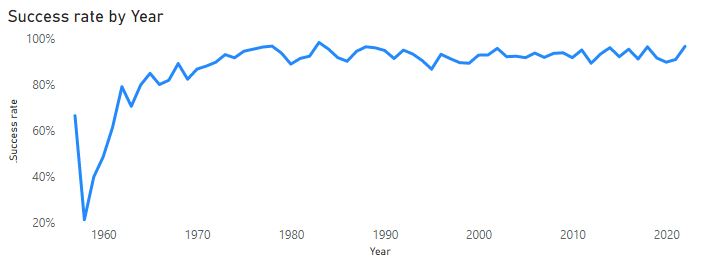
The CALCULATE in the nominator returns the number of successful missions, while the denominator counts all the missions. When we put this into the graph, the year filter context from the graph provides the annual success rate.
Insights:
The USSR made 2 successful launches in 1957 (Sputnik 1 and Sputnik 2). The US failed 1 mission in the same year.
The following year, 1958, in an effort to catch up in the Space Race, the US attempted 23 launches but only 5 were successful.
NASA was found in 1958 to coordinate the US space programs.
The global success rate reached 80% in 1962 and has not fallen below that since 1964.
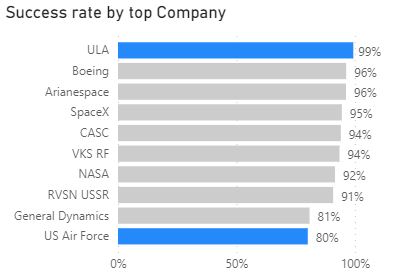
3. Which countries have had the most successful space missions?
The dataset only provides a list of companies but not the country of those companies. From reading about space exploration, we know space travel is expensive. Therefore, there are few countries actively engaged in this area. We can indirectly answer this question by looking at the top companies and referencing their countries.
However, we get a partial picture if we only look at the success rate. Some companies have a 100% success rate, but they only launched a small number of rockets. We also need to look at the total number of rockets launched to get a more general sense.
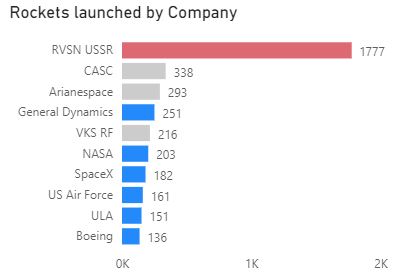
Bar charts are recommended when comparing values (rockets) between different categories (companies).
Insights:
RVSN USSR stood out as the company with the most rockets launched (1,777), way above the next two contenders (CASC of China and Arianespce of France).
The US has always been a major player in space travel with 5 companies in the top 10.
All top 10 companies have at least 80% success rate, with ULA achieves an outstanding 99% success rate.
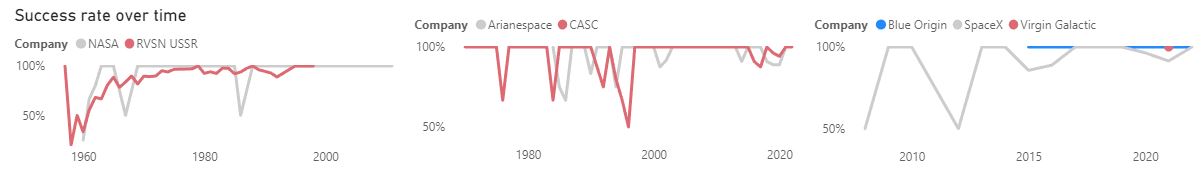
4. Has it always been that way?
This follow-up question to question 3 requires us to plot the success rate on a line chart. However, if we plot all companies on the same chart, it becomes unreadable. Instead, I plot several charts with companies with similar features (government enterprises, US private organisations and US defence-linked companies) for comparison.
Insights:
RVSN USSR appeared to achieve high success rate slower and was unable maintain over sustained periods, in comparison with NASA.
Arianespace (France) and CASC (China) both had rough start but seemed to stable after the year 2000.
Blue Origin and Virgin Galactic have exceptional success rate, but only launched their first rocket in the last decade. More time is needed to evaluate their long-term performance. US's Defence-linked companies are also experiencing fluctuated success rates.
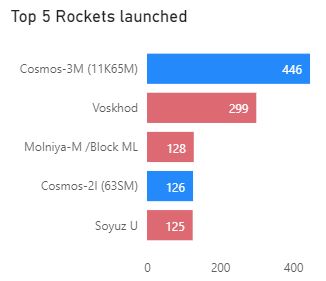
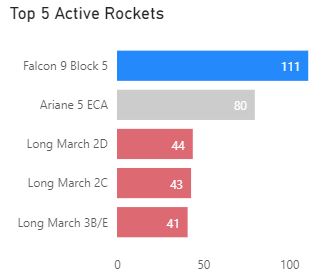
5. Which rocket has been used for the most space missions? Is it still active?
A bar chart can answer the first question, which shows USA/USSR rockets.
For the second question, the answer is simply ‘No’ for all rockets in the top 5, but it does not provide much insight. I included a second chart to show the current top active rockets. These two charts combined indicate a change in the sources of rockets.
To get the number of active rockets, we need another measure:Active count =
CALCULATE(
COUNT(space_missions[RocketStatus]),
space_missions[RocketStatus] = "Active"
)
Insights:
Throughout the history of space exploration, the US and the USSR/Russia launched the most rockets.
However, most of these rockets have been retired and new players emerged.
China is replacing Russia as a prominent player, with the Long March rockets.
In the US, private organisations like Space X are taking the stage with promising cheaper and reusable rockets like the Falcon 9.
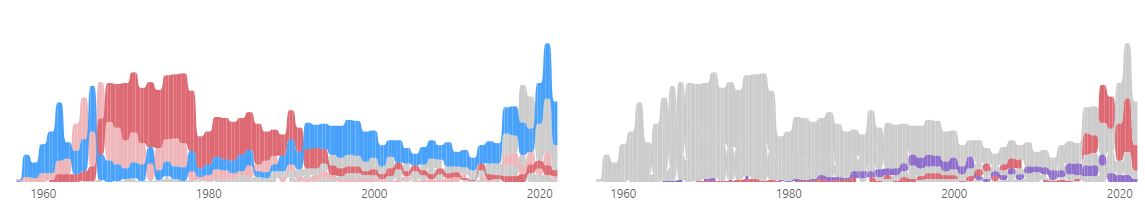
6. Are there any patterns you can notice with the launch locations?
Usually, the country that develops the rocket will launch using local infrastructure. Shipping rocket components would incur costs. Hence, the answer to this question will reinforce the insight from question 5. Not surprisingly, the change in launchpads' location coincides with the decline from Russia and the emergence of China.
Insights:
The downfall of the USSR in 1991 was a clear turning point. The USA led in the number of rockets launched after this event. In contrast, the use of launchpads in Russia and Kazakhstan (both formerly Soviet) never recovers to its prime during the 70s and 80s.
China has made great progress in space exploration recently, currently standing at number 2 in the world on launchpad usage.
France has gradual development, without any great leap.